Generate persistent clusters
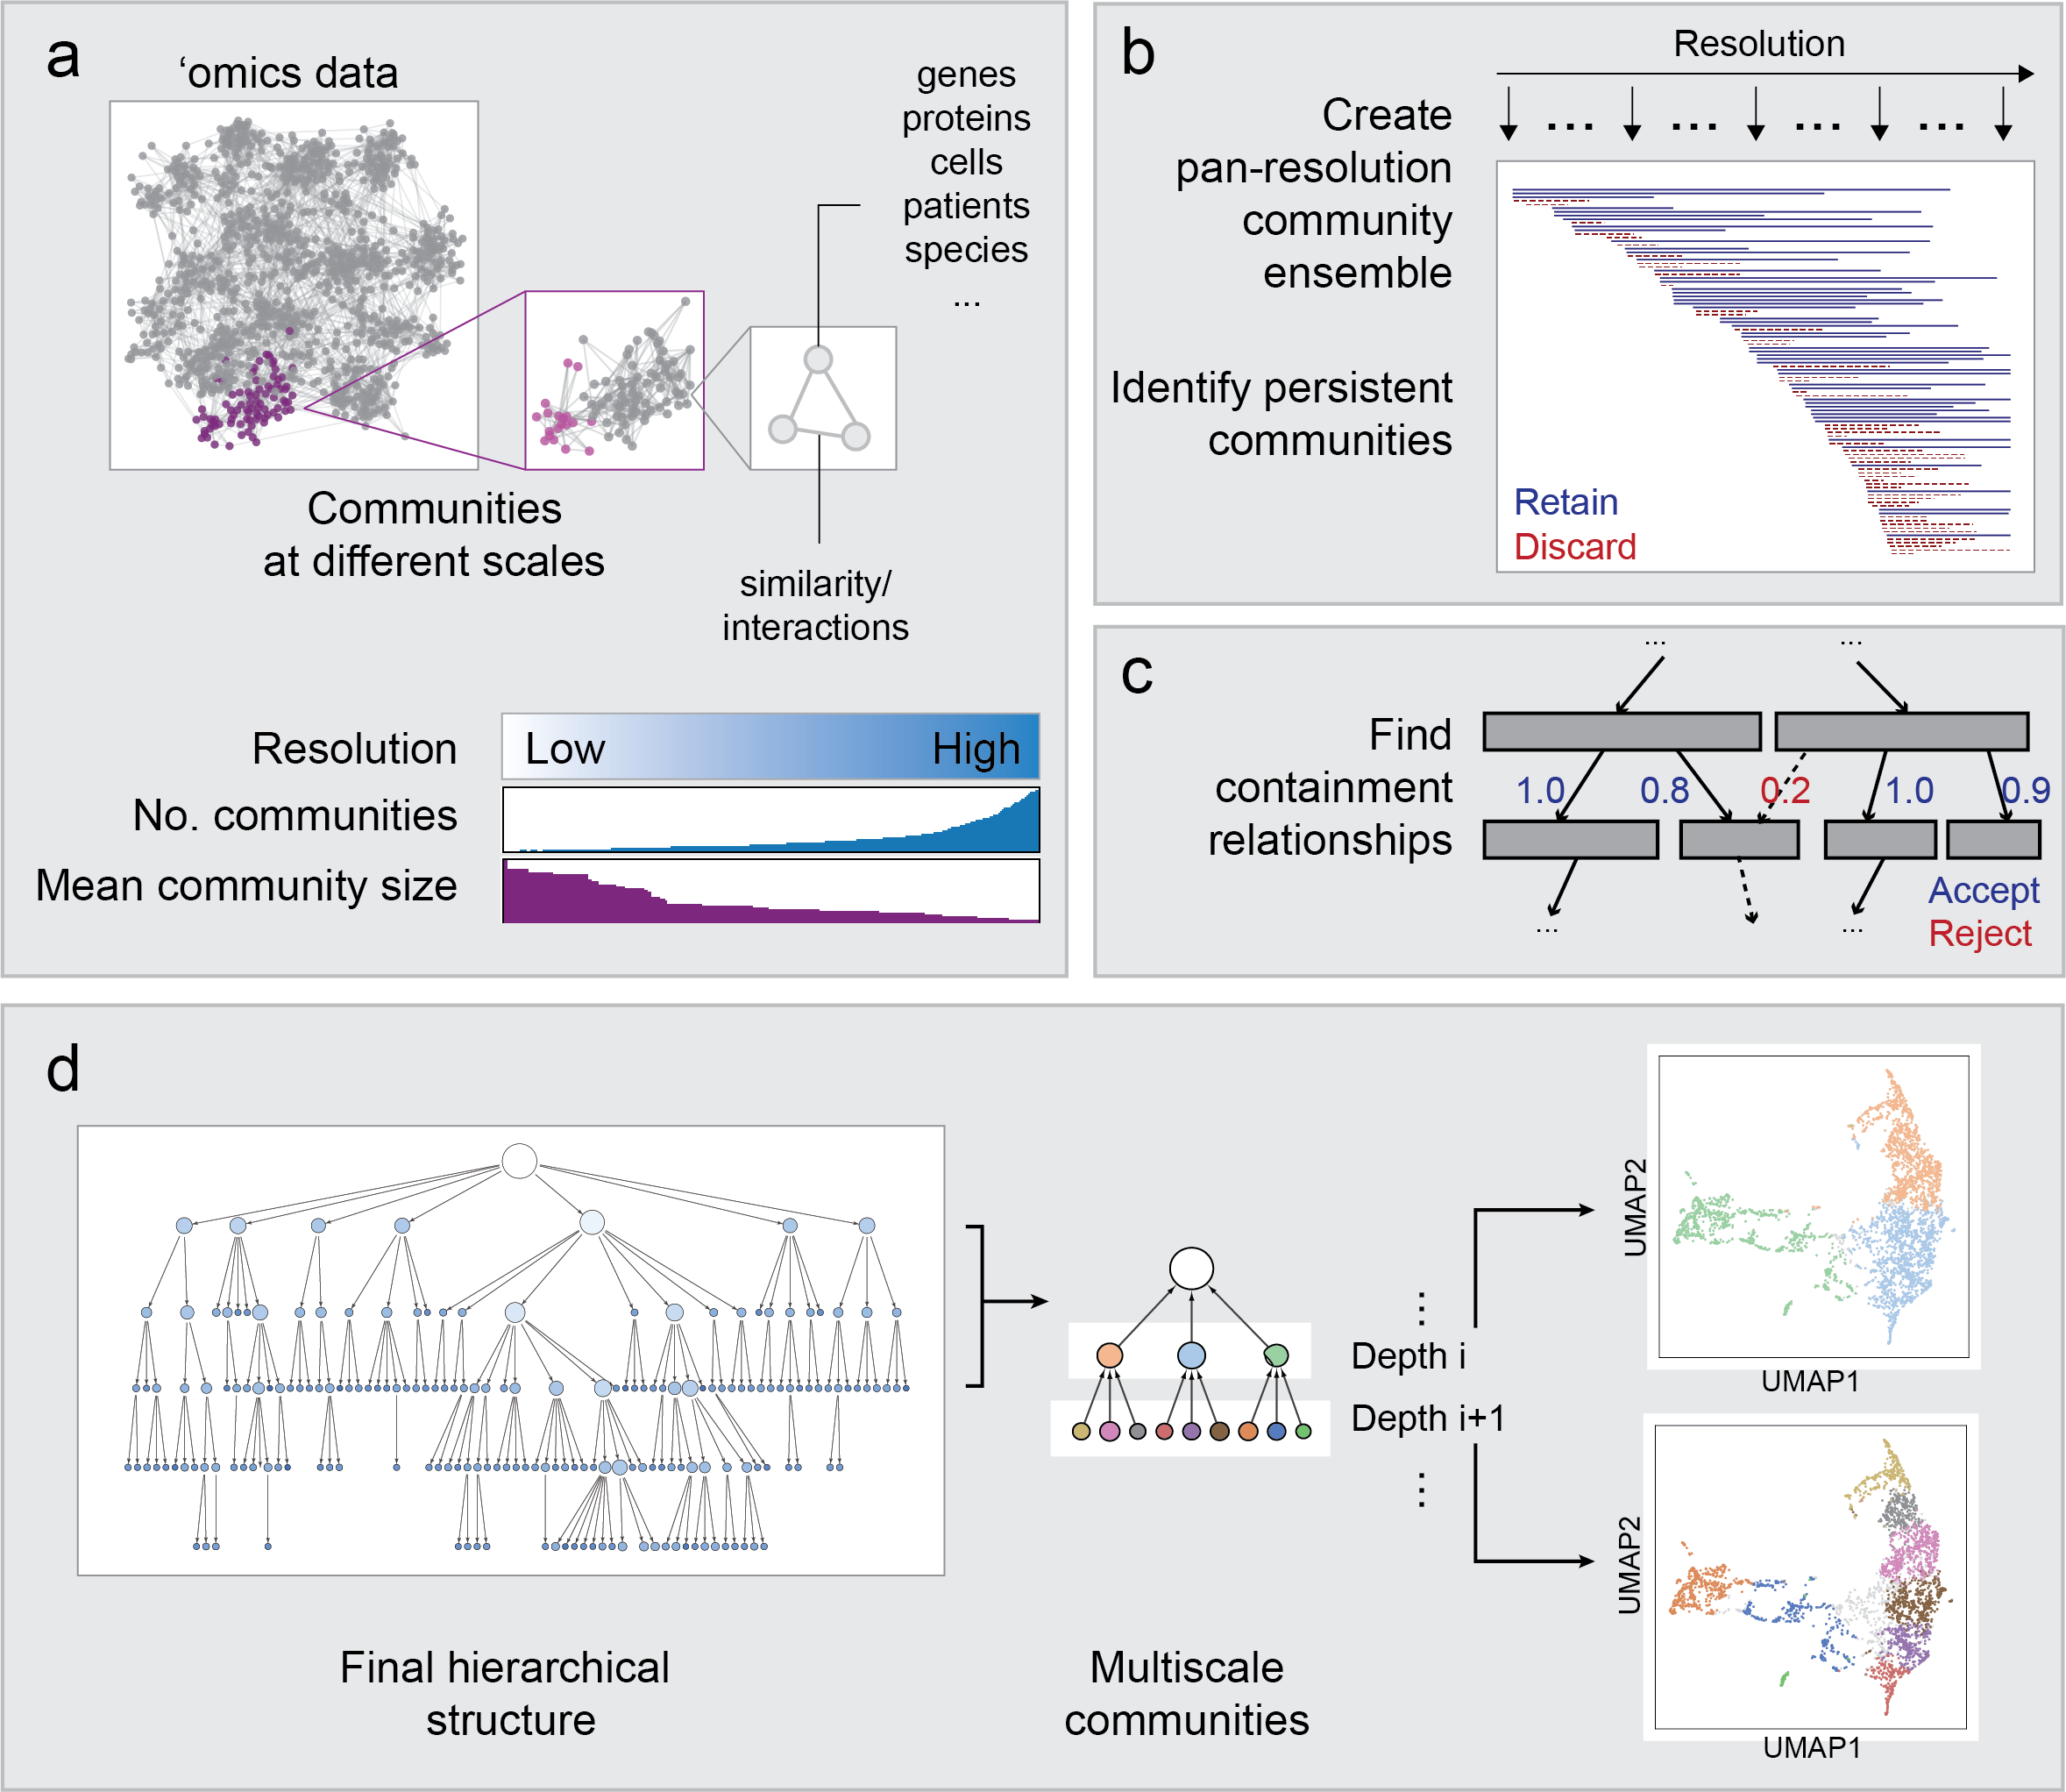
HiDeF ultilizes graph-based community detection (CD) with resolution parameters (such as Louvain [1] or Leiden [2] algorithms) to detect clusters. The resolution parameter was sampled at many values, and a set of communities was generated at each resolution. The solutions at each resolution were compared to each other. We define “persistent” communities as those repetitively discovered in many different resolutions.
As graph-based CD methods are in general heuristic, it is not common to find identical clusters repetitively. However, we can measure similarity between clusters. Imagining a graph in which each node represent a community and each edge connects two similar communities, a component in this graph a group of similar communities, and the size of these components can be seen as a metric of community persistence.
The following example takes the BioPlex [3] protein-protein interaction network, scans the resolution parameter from 0.001 to 25, and returns the communities with persistence larger than 5 (default parameters). Source files can be found in the examples directory.
python hidef_finder.py --g BioPlex.tsv --o BioPlex [--options]
Output formats
*.nodes: a .tsv file in which each row represents a community. The first 3 columns being the name, the size, and the elements of the community. See hidef_finder.output_nodes.
*.edges a .tsv file in which each row represents a directed edge. The first and second column indicate the target (parent) and source (child community, respectively. See hidef_finder.output_edges.
*.gml a file in the GML (Graph Modelling Language) format to represent the DAG. See hidef_finder.output_gml.
*.gmt GMT format as described in GSEA. (Coming soon)
Use the feature matrix of data points as input
The default input of HiDeF is a format representing a graph. Still, if the input data is in the format of feature vectors of data points, a k-nearest neighbor graph (kNN) or a shared k-nearest neighbor graph (sNN) can be generated by other methods, such as umap.umap_.nearest_neighbors or sklearn.neighbors.NearestNeighbors. HiDeF function jaccard_matrix can help convert kNN to sNN:
from hidef import utils
mat_knn = scipy.sparse.csr_matrix(mat_knn)
indices = utils.jaccard_matrix(mat_knn, mat_knn, threshold=0.1)
with open(outfile, 'w') as fh:
    for i in range(len(indices[0])):
        fh.write('{}\t{}\n'.format(indices[0][i], indices[1][i]))
Note
Building kNN or sNN graph followed by graph-based community detection is a common workflow of single-cell analysis in prominent software packages such as Seurat or Scanpy. However, the resolution parameter needs to be specified in those packages. HiDeF scans resolution parameters and makes it easy to identify structures at more diverse scales.